
KMICS Computer Fundamentals
- Teacher: BillaSol 1
KMICS Computer Fundamentals


A C Programming Course covers the basics of C language, including data types, variables, operators, and control structures (if, loops). It introduces functions, arrays, and pointers, teaching how to pass arguments and return values. Key concepts like memory management, recursion, and string manipulation are explored. Students learn how to write efficient, modular programs, with an emphasis on problem-solving and understanding the underlying system architecture. The course also introduces file I/O, error handling, and debugging techniques, with hands-on practice in compiling and running programs.
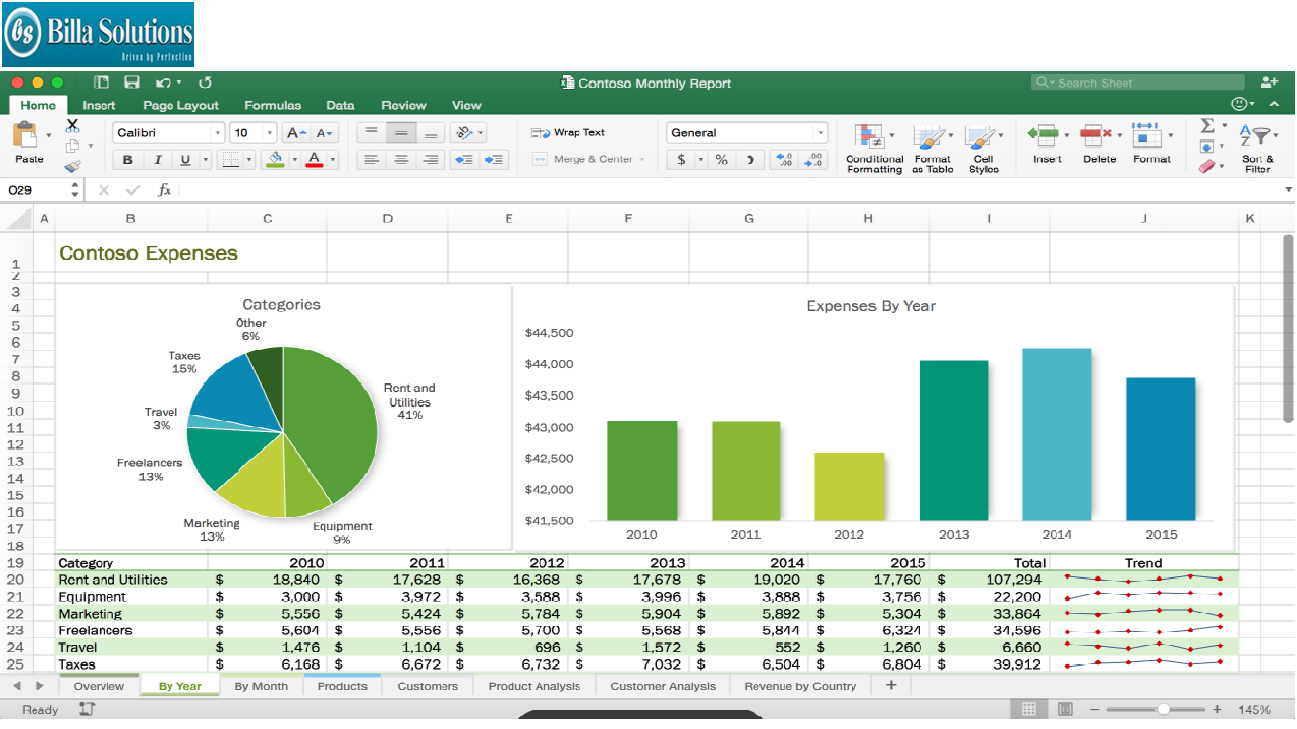
This course provides instructions with the fundamental spreadsheet features of Microsoft Excel. Topics covered in this document will help you become more proficient with the Excel application. Specific focuses include building spreadsheets, worksheet fundamentals, working with basic formulas, and creating charts.


Basics of a Computer – Characteristics of computer, Generations,
classification, Hardware - Components of CPU, Memory – hierarchy,
types of memory, Input and output devices. Software – systems
software, application software, packages, frameworks, IDEs.

Python Programming Description

Microsoft Excel is an incredibly powerful and dynamic data visualization platform for those willing to think beyond rows, columns, and spreadsheets, and I'm here to prove it.
This course gives you a deep, 100% comprehensive understanding of MS Excel's latest data visualization tools and techniques. I'll show you WHEN, WHY, and HOW to use each Excel chart type, introduce key data visualization best practices, and guide you through interactive, hands-on demos and Excel exercises every step of the way.
We'll kick things off by exploring each of the 20+ charts & graphs in Excel, including:
Bar & Column charts
Histograms & Pareto charts (Office 365, Excel 2016 or Excel 2019)
Line charts, Area charts & trend lines
Pies & Donuts
Scatter plots & Bubble charts
Box & Whisker charts (Office 365, Excel 2016 or Excel 2019)
Tree Maps & Sunbursts (Office 365, Excel 2016 or Excel 2019)
Waterfall & Funnel charts (Office 365, Excel 2016 or Excel 2019)
Radar & Stock charts
Heat maps, 3-D Surface & Contour charts
Choropleths & Geospatial maps
Custom Combo Charts
Sparklines
From there we'll dive into a series of advanced Excel demos guaranteed to turn you into an absolute data visualization and analytics rockstar. These aren't "textbook" demos that you can find on Excel YouTube channels; these are projects and dashboards adapted from actual, award-winning work featured by Microsoft, MIT, and the New York Times.
We'll cover advanced Excel data visualization topics that you won't find anywhere else, including:
Custom image overlay charts
Automation with named ranges and OFFSET/COUNTA functions
Scroll & Zoom functionality with Excel form controls
Animated charts to visualize changes over time
Dynamic, custom Excel dashboards
Value-based chart formatting
Custom gauge charts & pacing charts
Grid visuals using Excel array formulas
Whether you're looking for a quick primer, trying to diversify your Excel skill set, or hoping to step up your Excel data visualization or business intelligence game in a major way, this course is for you.
Certified Scrum Master
Computer Fundamentals
Microsoft Word
Microsoft Excel
Microsoft PowerPoint
Basics of Web Design
Accounting Basics